AltEnergyMag had a residential PV system installed and is monitoring the process as well as the performance. This is part 2 of a series of articles we will publish along the way in order to demonstrate and explain a real world project for our readers to follow and learn from.
Bob Hetherington | AltEnergyMag
If you haven't read Part 1 - click here
We’ve been living with the PV system now for a few months and it is working like a charm. Has it changed our lives ---- probably. Until you witness your electrical meter running backwards --- day after day --- you won’t understand how good that feels. And until your utility company sends a letter saying there will be no more payments until the end of the year --- at which time it will be determined who owes who --- you won’t get that warm fuzzy feeling when the lights go on.
So let’s talk about how the project construction phase ended up and where we are today.
Inspections, Start-up and Smart Meter
Once Tenco Solar finished work they notified the city and the utility to schedule inspections. While some people view this as an inconvenience and bureaucratic process, I welcome it since it brings some expertise and standards into the process to help me feel that my new system is safe and that the workmanship is acceptable. Yes, there seems to be overkill as far as the paperwork that our contractor had to produce, but the physical inspection is necessary and in our case everything passed. Inspectors from both the utility and the city showed up the next day so no delays were experienced with this part of the process.
While the inspector from the utility company was here, he installed a new smart meter which has the capability of running backwards --- nice. His focus was on the metering of course and he was satisfied that we were in good shape.
Much of the city inspection seemed to be focused on the correct signage being placed on our electrical panel --- warning that the solar system is active. This of course is to prevent an electrician from working on the system without knowing that the panel is hot even with the main breaker off. Makes good safety sense to me and in fact we had an electrician on site recently and made sure to tell him to pay attention to the warnings.
So we passed inspection and the switch was flipped on --- somehow a bit underwhelming. There is no run-up or growling of equipment to signify the event. But there is that little arrow on the smart meter indicating that it is running backwards --- and the numbers are counting down instead of up. I’ll bet President Obama would like to see that happen to the debt clock!
The Monitoring System
Without some sort of monitoring system there is no way of tracking or troubleshooting the performance of the system. In our case, we chose to use micro inverters so we could track each module individually thus seeing performance differences due to orientation as well as physical environmental changes --- or to track down module problems.
Enphase does a good job of this and at the time of this project they dominate the micro inverter market. To set the system up, Tenco had to map the modules on a graphic representation (via serial number) so their performance could be displayed on a secure web page for us to view.
The system works by sending data from each inverter over the powerlines to an internet bridge which is plugged into our home network router. (We can thank the Home Technology Industry for the advancements that make this possible – plug www.hometoys.com – another of our online publications).
Here are some of the graphics and data that we are able to monitor with the system.

Above you can see our layout with 14 modules on the south slope and 3 on the east facing slope. The number on each module represents the energy it has generated since installation. You can see that the east facing modules do not produce as much as the south facing group --- but not by as much as I expected. The main purpose of this view is to show how the modules are performing and to quicly spot any that are not up to expectations.
This view can be generated for different date ranges so you can see how the system performed in the past. There is also an animated view to look at the instantaneous power each module has generated. If you look at the last week for example, the animation takes you through the week showing the sun rise and power quantities as they are recorded. Fun to watch.

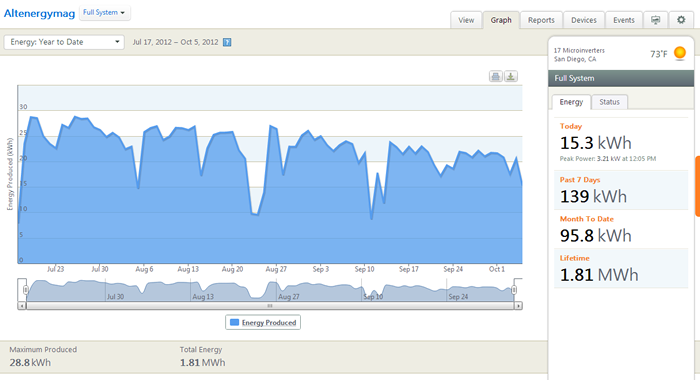
This next graph above shows the "Energy" production of our system since installation. As you can see we are averaging approximately 20 kWh per day from the system at this time. As fall and winter approach the days are getting shorter so the total energy numbers are decreasing. How do I know that the system is not just getting less efficient? See the next graph.

This graph shows a daily record of the "Power" produced by the system. As we can see, the system is still reaching approximately the same peak power each day --- just over 3 kW --- which means it is performing steadily. The maximum is recorded at 3.51 kW. If I look back at the July numbers they look close to this with a max of 3.73 kW. This is to be expected as the sun angle decreases as winter approaches.
Overall - How is the system doing?
We’ve been up and running for two months now and the system is operating without a hitch as far as we can tell from the data seen above. A few things we noticed along the way:
- Remember how we installed the modules on top of the existing pool solar heating system. The good news is that we are still heating the pool with that system although not quite as effectively as far as I can tell. Bottom line for me though --- no need to throw away your pool heating system to install PV modules. Some free heat with already existing equipment is worth any inconvenience the installer may encounter. The key element here is to make sure the sensor for the pool heating system is relocated to a spot between a module and the heating tubes so that is senses the heat buildup there and brings on the pool system.
- We also wanted to see if having the pool system in operation would increase the efficiency of the PV modules by providing some cooling. To be honest, I have not been able to detect a difference so if there is an improvement it is a small one.
- The system is installed on a low sloping hip style roof and there are 3 modules facing in an easterly direction. To date these modules are gathering about 85% of the energy that the south facing modules are. This is better than I expected and warrants those without direct southerly exposure a close look as to whether or not to consider a PV system on an east or west facing roof. Of course the steeper the slope, the shorter the time of activity for the modules.
- As advertised, even on overcast days (although not so many of these in San Diego this summer) we are still producing electricity although at a substantially lower rate.
- As fall and winter are approaching it is easy to see the reduction in production as the daylight hours decrease and the sun gets lower in the sky. We’ll be keeping an eye on this over the year to get a feel for how this all works.
In case you haven’t noticed, I’m a bit of a data freak and am loving the scenarios I am able to follow with this system in place. Someone asked me if a solar system was really worth it financially. I asked them if they justified their 60” home theater purchase with the same scrutiny. The answer was that their home theater provided entertainment. I guess they are not data freaks :-)
The Financial Analysis
I’m not going to spend a bunch of time trying to analyze the financial payback for this system since we built it as a demo and did not really try to optimize the design or cost benefits. Instead, here are some links to others far more qualified than I am to present the financial case as well as some online solar calculators to help you determine if solar is right for you --- in your location.
- Tenco Solar has a quick system estimator
- A bit more info in this solar calculator from SunWize
- And thanks to NREL, here is a great tool with even more data - PVWATTSv.1
I will however promise to report back once enough time has gone by to make a value judgment taking into account our settlement at the end of the year with the utility company.
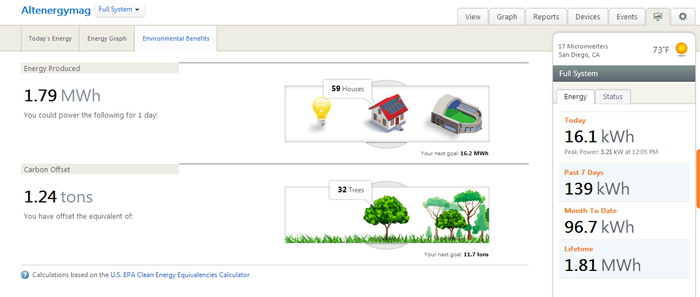
One thing I can tell you though. It feels wonderful to be an energy producer and I know the long term benefits go far beyond just the dollars we may save. Here is a nice little screen the monitoring system gives us to bring that message home.

Stay tuned for ongoing updates as we learn to live with our PV Solar system over the next few months. I’ll report back with more observations. Ongoing monitoring is really the only way to know how any system performs and as I said above --- data is my friend.
Many thanks again to the companies who helped us make this possible. Here again is a summary of who they are and what they did for us:
- LG Solar supplied us with all of the PV modules. 17 - LG255S1C-G2 High Efficiency Mono X Modules
- Schletter supplied the racking system.
- EcoFasten Solar provided the GreenFasten™ roof mounting system.
- Tenco Solar did the installation of the system and supplied the micro-inverters and other bits and pieces required.

The content & opinions in this article are the author’s and do not necessarily represent the views of AltEnergyMag
Comments (0)
This post does not have any comments. Be the first to leave a comment below.
Featured Product


