India Renewable Power Market Trends 2001 to 2020
India Renewable Energy Market Trends Analysis and Forecasts
Contributed by | GlobalData
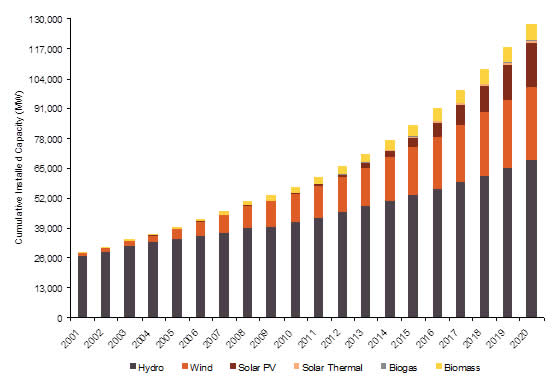
India Renewable Power Market including Hydro, Installed Capacity, MW, 2001-2020
Hydro power dominates the total renewable power installed capacity with a share of nearly74.25% in 2009.The cumulative installed capacity has increased to 39,404 MW in 2009 from 26,269 MW in 2001 at a CAGR of 5.2% during the period. By 2020, the Hydro power generation capacity is expected to reach 68,243 MW with a CAGR of 5.1% from 2009. With the increasing installations of wind, solar and bio-energy facilities in the country, the share of hydro power in total renewable power generation capacity of country is projected to reduce to nearly 53% by 2020 from 74% in 2009.
Hydro power dominates the total renewable power installed capacity with a share of nearly74.25% in 2009.The cumulative installed capacity has increased to 39,404 MW in 2009 from 26,269 MW in 2001 at a CAGR of 5.2% during the period. By 2020, the Hydro power generation capacity is expected to reach 68,243 MW with a CAGR of 5.1% from 2009. With the increasing installations of wind, solar and bio-energy facilities in the country, the share of hydro power in total renewable power generation capacity of country is projected to reduce to nearly 53% by 2020 from 74% in 2009.
With the increasing support to the renewable sources, the wind, solar and biomass power installations are on rise. The wind power installed capacity has grown from 1,407 MW in 2001 to 10,925 MW in 2009 at a CAGR of 29.2%. By 2020, the cumulative wind power capacity is expected to reach 32,200 MW with a CAGR of 10.3% since 2009.
The solar PV installed capacity has elevated at a CAGR of 26.0% during 2001 to 2009. The Solar PV installed capacity has reached to 178 MW in 2009 from 28 MW in 2001. By 2020, the cumulative installed capacity is expected to reach 18,788 MW at an impressive CAGR growth of 52.7% during 2009 to 2020. The Jawaharlal Solar Mission targets are setting stage to achieve such phenomenal growth number.
Biomass power installation in the country has increased from 349 MW in 2001 to 2,450 MW in 2009 at a CAGR of 27.6%. By 2020, the biomass power installed capacity is expected to reach at 7,286 MW at a CAGR of 10.4% from 2009.
 |
|
Source: GlobalData
|
|
Year
|
Hydro
|
Wind
|
Solar PV
|
Solar Thermal
|
Biogas
|
Biomass
|
Total
|
|
2001
|
26,269
|
1,407
|
28
|
|
48
|
349
|
28,101
|
|
2002
|
28,260
|
1,702
|
33
|
|
53
|
447
|
30,496
|
|
2003
|
31,026
|
2,125
|
43
|
|
58
|
572
|
33,824
|
|
2004
|
32,546
|
3,000
|
60
|
|
62
|
712
|
36,380
|
|
2005
|
33,831
|
4,430
|
76
|
|
69
|
920
|
39,326
|
|
2006
|
35,468
|
6,270
|
88
|
|
83
|
1,173
|
43,082
|
|
2007
|
36,656
|
7,850
|
108
|
|
87
|
1,500
|
46,201
|
|
2008
|
38,848
|
9,587
|
148
|
|
104
|
2,015
|
50,702
|
|
2009
|
39,404
|
10,925
|
178
|
|
110
|
2,450
|
53,067
|
|
2010
|
41,422
|
12,285
|
280
|
|
117
|
2,773
|
56,876
|
|
2011
|
43,542
|
13,752
|
540
|
25
|
124
|
3,139
|
61,122
|
|
2012
|
45,771
|
15,362
|
1,008
|
33
|
133
|
3,550
|
65,858
|
|
2013
|
48,115
|
17,120
|
1,770
|
40
|
144
|
3,941
|
71,129
|
|
2014
|
50,578
|
18,865
|
2,868
|
206
|
155
|
4,375
|
77,047
|
|
2015
|
53,167
|
20,756
|
4,328
|
371
|
169
|
4,855
|
83,646
|
|
2016
|
55,889
|
22,775
|
6,248
|
537
|
185
|
5,387
|
91,020
|
|
2017
|
58,750
|
24,986
|
8,638
|
703
|
202
|
5,810
|
99,089
|
|
2018
|
61,758
|
27,326
|
11,518
|
869
|
221
|
6,266
|
107,958
|
|
2019
|
64,919
|
29,752
|
14,898
|
1,034
|
243
|
6,757
|
117,603
|
|
2020
|
68,243
|
32,200
|
18,788
|
1,200
|
266
|
7,286
|
127,982
|
|
CAGR 2001-2009
|
5.2%
|
29.2%
|
26.0%
|
|
11.0%
|
27.6%
|
8.3%
|
|
CAGR 2009-2020
|
5.1%
|
10.3%
|
52.7%
|
|
8.4%
|
10.4%
|
8.3%
|
|
Source: GlobalData
|
|||||||
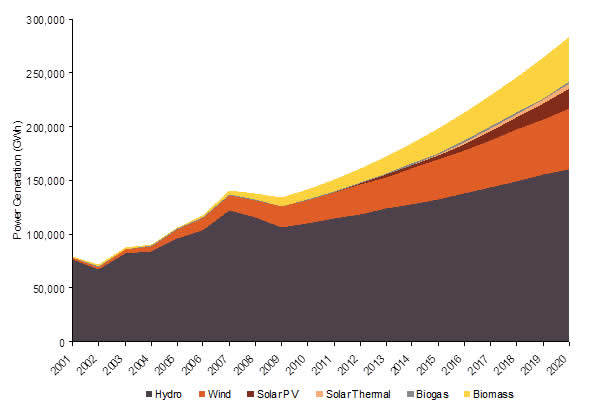
India Renewable Power Market, Power Generation, GWh, 2001-2020
Hydro power has been a key renewable source of energy in the country, accounted for approximately 79.39% of the total power generated from all renewable sources in 2009. The share of hydro power in the total renewable energy sources is expected to decline to nearly 56.7% by 2020 from its level of 79.39% in 2009. In absolute terms, hydro contributed 106,189 GWh in 2009 and expected to contribute 160,724 GWh in 2020.
The wind is second largest renewable source of energy in renewable generation portfolio. The wind power generation in the country has increased at a CAGR of 30.5% from 2,271 GWh in 2001 to 19,141 GWh in 2009. By 2020, the wind power generation is expected to reach at 56,414 GWh at a CAGR of 10.3% during 2009 to 2020.
Biomass power generation in the country has grown from 917 GWh in 2001 to 7,654 GWh in 2009 at a CAGR of 30.4%. By 2020, the bio-mass power generation is likely to reach at 41,489 GWh at a CAGR of 16.6% from 2009.
 |
|
Source: GlobalData
|
|
Year
|
Hydro
|
Wind
|
Solar PV
|
Solar Thermal
|
Biogas
|
Biomass
|
Total
|
|
2001
|
76,236
|
2,271
|
57
|
|
265
|
917
|
79,745
|
|
2002
|
67,397
|
2,564
|
67
|
|
293
|
1,174
|
71,495
|
|
2003
|
81,784
|
3,723
|
87
|
|
320
|
1,503
|
87,417
|
|
2004
|
83,876
|
5,256
|
99
|
|
342
|
1,871
|
91,444
|
|
2005
|
96,520
|
7,761
|
108
|
|
381
|
2,014
|
106,784
|
|
2006
|
103,639
|
10,985
|
114
|
|
456
|
2,843
|
118,037
|
|
2007
|
122,410
|
13,753
|
121
|
|
478
|
3,985
|
140,747
|
|
2008
|
115,006
|
16,796
|
145
|
|
572
|
5,824
|
138,344
|
|
2009
|
106,189
|
19,141
|
174
|
|
605
|
7,654
|
133,763
|
|
2010
|
110,266
|
21,523
|
274
|
|
659
|
9,313
|
142,036
|
|
2011
|
114,500
|
24,094
|
529
|
77
|
718
|
11,274
|
151,191
|
|
2012
|
118,897
|
26,914
|
988
|
100
|
782
|
13,581
|
161,261
|
|
2013
|
123,462
|
29,994
|
1,735
|
140
|
852
|
15,997
|
172,180
|
|
2014
|
128,203
|
33,052
|
2,812
|
721
|
928
|
18,781
|
184,496
|
|
2015
|
133,126
|
36,365
|
4,243
|
1,302
|
1,011
|
21,974
|
198,019
|
|
2016
|
138,237
|
39,902
|
6,125
|
1,976
|
1,119
|
25,640
|
213,000
|
|
2017
|
143,545
|
43,776
|
8,469
|
2,586
|
1,239
|
29,012
|
228,626
|
|
2018
|
149,057
|
47,875
|
11,292
|
3,424
|
1,372
|
32,750
|
245,770
|
|
2019
|
154,781
|
52,126
|
14,606
|
4,077
|
1,529
|
36,895
|
264,014
|
|
2020
|
160,724
|
56,414
|
18,420
|
4,730
|
1,705
|
41,489
|
283,483
|
|
CAGR 2001-2009
|
4.2%
|
30.5%
|
14.9%
|
|
10.9%
|
30.4%
|
6.7%
|
|
CAGR 2009-2020
|
3.8%
|
10.3%
|
52.7%
|
|
9.9%
|
16.6%
|
7.1%
|
|
Source: GlobalData
|
|||||||
About GlobalData
GlobalData is an industry analysis specialist company providing business information products and services.
Our highly qualified team of Analysts, Researchers, and Solution Consultants use proprietary data sources and various tools and techniques to gather, analyze and represent the latest and the most reliable information essential for businesses to sustain a competitive edge.
If you have any queries about this report or would like further information, please contact
North America: +1 646 395 5460
Europe: +44 207 406 6653
+44 1204 543 523
Asia Pacific: +91 40 6616 6700
Email: info@globaldata.com
The content & opinions in this article are the author’s and do not necessarily represent the views of AltEnergyMag
Comments (0)
This post does not have any comments. Be the first to leave a comment below.
Featured Product
SOLTEC - SFOne single axis tracker
SFOne is the 1P single-axis tracker by Soltec. This tracker combines the mechanical simplicity with the extraordinary expertise of Soltec for more than 18 years. Specially designed for larger 72 an 78 cell modules, this tracker is self-powered thanks to its dedicated module, which results into a lower cost-operational power supply. The SFOne has a 5% less piles than standard competitor, what reduces a 75% the labor time.